

- PV-Station-Solutions
- PV-Panel-Testing-Solutions
- Silicon-Ingot-Testing-Solutions
To investigate the spectral response characteristics of perovskite solar cells under specific illumination conditions.
Combined with photoluminescence (PL) imaging technology, to explore the local electronic properties of perovskite materials and directly reflect internal defects of the materials.
To analyze the relationship between the PL emission peak and the theoretical optimal PL band, and evaluate the luminescence characteristics of the materials.
Spectral Response Analysis: A hyperspectral camera is used to obtain the spectral response characteristics of perovskite solar cells under specific illumination conditions.
Photoluminescence (PL): Under the excitation of light, perovskite materials emit light of specific wavelengths. This process can reflect the carrier recombination and charge transport characteristics of the materials. PL imaging technology enables the acquisition of luminescence information on the cell surface, thus evaluating its local electronic performance.
Optimal PL Band: Theoretically, the PL emission peak of perovskite materials is correlated with their bandgap and carrier recombination characteristics. The optimal PL band usually corresponds to the matching range between the light absorption band of the material and the photoelectric conversion efficiency.
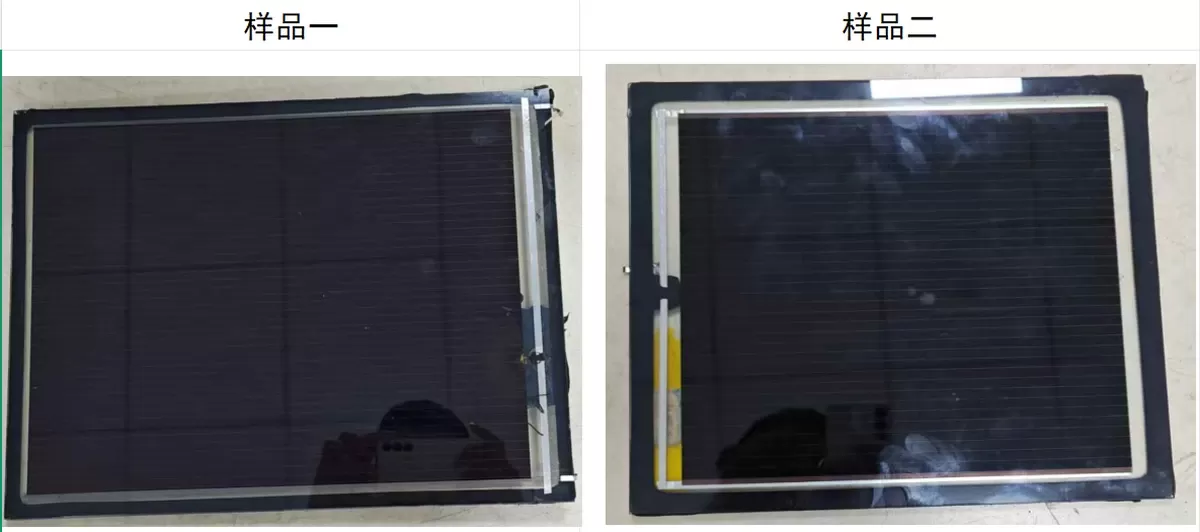
Perovskite solar cell samples (homemade or commercial perovskite materials)
Hyperspectral camera
Photoluminescence (PL) system (equipped with laser light source and spectrum analyzer)
PL imaging system (high-resolution camera and upper computer control system)
Treat the perovskite solar cell samples and mount them on the PL imaging system, ensuring the sample surface is clean and free of contamination.
Conduct specific spectral imaging analysis on the samples.
Excite the samples using a laser light source, selecting a laser of specific wavelength for irradiation.
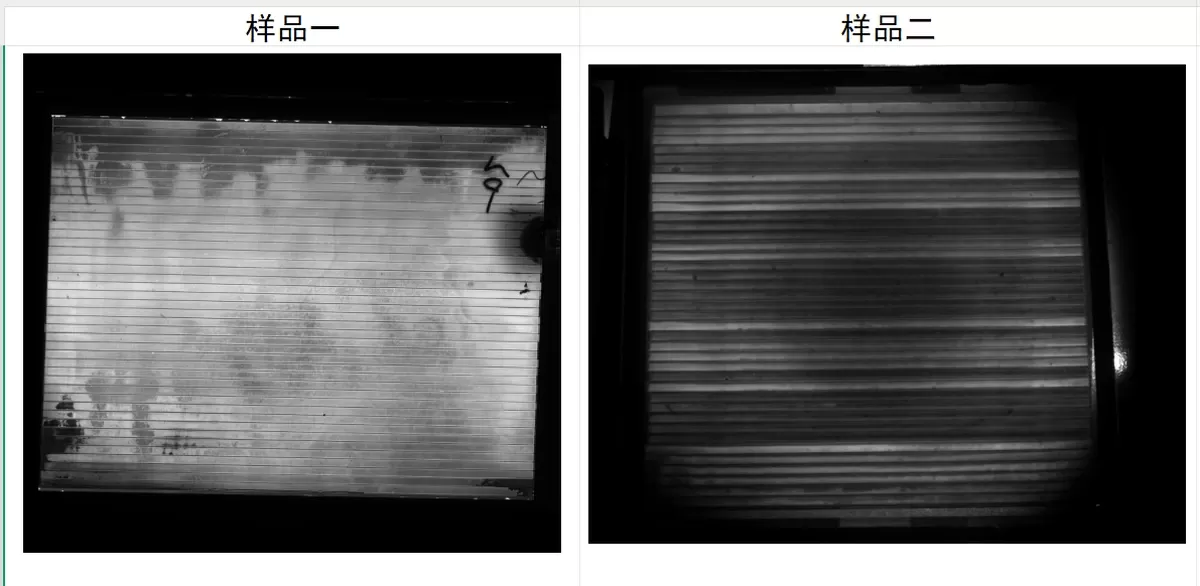
Acquire PL images of the sample surface via the PL imaging system, and analyze the PL intensity and emission peak position in different regions.
Record the PL emission spectrum and extract the position and intensity of the emission peak.
Scan and capture images of the perovskite solar cells using a hyperspectral camera to obtain spectral imaging in specific bands.
Analyze the spectral curves of the hyperspectral camera imaging in specific bands, and determine the optimal imaging band and spectral characteristics.
Compare the PL intensity in different regions and discuss the electronic behavior of the material in local areas (such as carrier recombination and migration).
Evaluate the carrier lifetime and recombination characteristics of the perovskite material, directly reflecting the internal defects of the material.
A larger bandgap (e.g., 1.6 eV) results in a shorter PL peak wavelength (approximately 775 nm).
A smaller bandgap (e.g., 1.4 eV) results in a longer PL peak wavelength (approximately 885 nm).
The theoretical PL peak is generally around 830 nm (corresponding to a bandgap of 1.5 eV), but the specific position varies with the type of perovskite material, ranging approximately from 700 nm to 900 nm.
The theoretical PL (photoluminescence) peak of perovskite solar cells is usually correlated with the bandgap of the material. The bandgap of perovskite materials typically ranges from 1.4 eV to 1.6 eV, depending on the specific material composition and structure.
The relationship between wavelength and bandgap is expressed by the following formula:
Eg=hc/λ
Where:Eg is the bandgap of the material (unit: eV)
λ is the wavelength of the emitted light (unit: nm)
Assuming the bandgap of the perovskite material is 1.5 eV, the theoretical PL peak wavelength can be calculated as follows:
λ=hc/Eg=1.24/1.5=0.82667
Therefore, theoretically, the PL emission peak of perovskite solar cells should be around 826.67 nm (approximately 830 nm).
The PL emission peak of perovskite materials typically falls within the range of 700 nm to 900 nm, depending on the specific value of the bandgap.
Conclusion| Sample 1 | Peak Value | Sample 2 | Peak Value | |
|---|---|---|---|---|
| Position 1 | 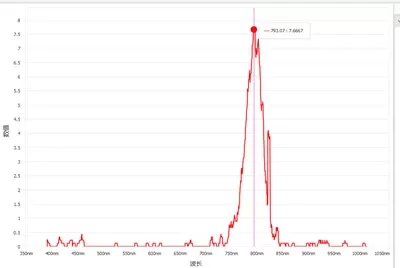 | 793nm | 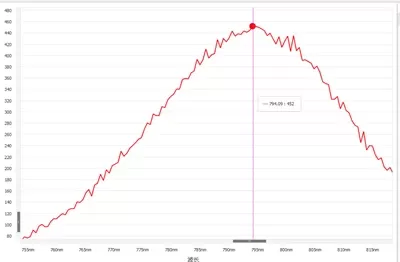 | 794nm |
| Position 2 | 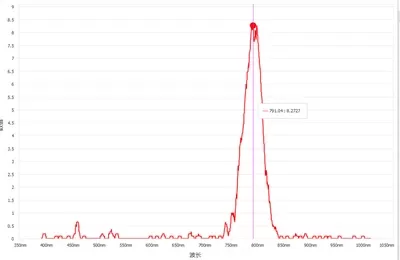 | 791nm | 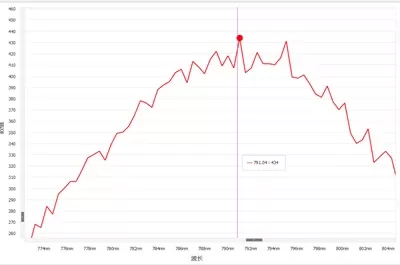 | 791nm |
| Position 3 | 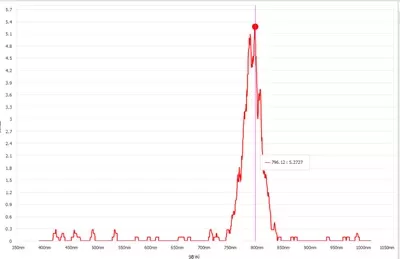 | 796nm | 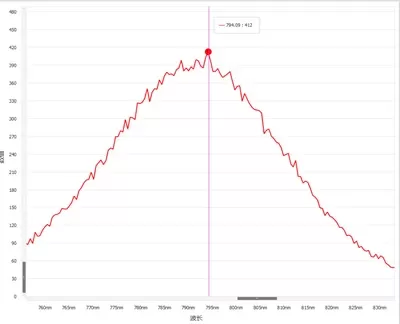 | 794nm |
PL Images: Show the PL intensity distribution in different regions and mark the emission peak positions.
PL Emission Spectra: List the PL emission peaks at different wavelengths, and analyze the luminescence intensity and peak positions.
Spectral Response Data: Include absorption spectrum and reflection spectrum data.
Comparison between Theoretical and Experimental PL Bands: Summarize that the theoretical PL band is roughly consistent with the experimental results.
Using PL imaging technology, the local optoelectronic properties and carrier recombination characteristics of perovskite solar cells were successfully detected.
The experimental results show that the PL emission peak of the perovskite material is consistent with the theoretical value, matching the predicted band corresponding to a bandgap of approximately 1.5 eV. The theoretical PL peak is generally around 830 nm (corresponding to a bandgap of 1.5 eV), but the specific position varies with the type of perovskite material, ranging approximately from 700 nm to 900 nm.
There is a significant correlation between PL intensity and cell performance. Higher PL intensity usually indicates lower carrier recombination rate, which is conducive to improving the photoelectric conversion efficiency of the cell.
Environmental factors have a certain impact on PL emission and optoelectronic performance. Further optimizing the synthesis and structure of the material is helpful to improve cell efficiency.
The Perovskite PL Imaging Inspection All-in-One Machinedeveloped by Nanjing Shichuang Intelligence covers mainstream and cutting-edge photovoltaic technology routes. It can detect crystalline silicon cells (PERC, TOPCon, HJT, xBC, etc.), perovskite single-junction cells (including flexible cells), and crystalline silicon-perovskite tandem cells (single-terminal/double-terminal). It is suitable for research and development in universities and laboratories as well as quality control in industrial mass production, covering the full-life-cycle inspection of solar cells.

contact
Be the first to know about our new product launches, latest blog posts and more. Nanjing Vision Potential Intelligent Technology Co.,Ltd.Established based on the Nanjing Xiangning Artificial Intelligence Research Institute, we have brought together a number of outstanding industry... Any question or request?
Click below, we’ll be happy to assist. contact